 English resume
Robustness of fresh water
Robustness is a popular term in water management. It triggers associations with strong and invulnerable; if an object is robust, it will not break down easily.
|
Thema |
Waterveiligheid, Delta facts, English versions |
|
Tags |
B&O waterkeringen B&O watersystemen klimaatadaptatie primaire keringen regionale keringen |
|
Downloads |
- INTRODUCTION
- RELATED TOPICS AND DELTA FACTS
- SYSTEM ROBUSTNESS
- DECISION ROBUSTNESS
- RELATIONSHIP WITH MULTILAYER SAFETY
- FIELD EXPERIENCE
- CURRENTLY ACTIVE RESEARCH
- KNOWLEDGE GAPS
Introduction
Why this fact sheet?
Robustness is a popular term in water management. It triggers associations with strong and invulnerable; if an object is robust, it will not break down easily. This is part of the reason the term is used in all manner of ways and in all kinds of contexts. The National Water Plan (2009) formulates it as follows: ‘A robust water system or robust spatial organisation can generally withstand extreme events and can meet the demands posed by different potential future developments’. This has to do with both natural variability (‘extreme events’) and changes (‘future developments’). The Dutch Advisory Council for Transport, Public Works and Water Management (2009) recommends enhancing the robustness of infrastructure systems in order to prevent or control damage when uncertainties exist.

Currently, various definitions of robustness are implicitly used in the field, which can lead to confusion as to what is really meant. In various studies, the term robustness is defined and translated into quantifiable terms, giving the user a clear understanding of what to look for when applying the term. This fact sheet introduces two possible iterations of robustness: system robustness and decision robustness. Both are seen as relevant approaches to water management.
Robustness and uncertainty
Robustness has a clear relationship with uncertainty. In water management there are three known uncertainties: natural variability (e.g. precipitation, discharge), knowledge gaps (e.g. what causes a dike breach), and differences in social preferences. For long-term investments, such as infrastructure for water management, there is also the added dimension of future uncertainties: climate change and socio-economic development.
Our overall objective in water management is to reduce uncertainties by conducting more research, for example by performing more measurements and refining models. However, some uncertainties cannot be reduced. In fact, some would even argue that increased knowledge often raises new questions that lead to new uncertainties (e.g. knowledge of the piping mechanism for dikes, which has led to increased uncertainty about dike failure). We increasingly recognise that uncertainties will always exist. Hence, our commitment to pursuing practices that will help us understand the extent to which systems are vulnerable to uncertainties, and enable us to reduce such vulnerabilities and or susceptibilities. The concept of robustness fits well with this development.
Robustness analysis
When analysing robustness, it is essential to specify the ‘of what' and 'for what' in explicit terms:
- Robustness of what: a system or decision, where system can be limited to a physical object (such as a dike or a building), or where in fact it refers to a coupled socio-economic and physical system (e.g. urban area or river with hinterland area);
- Robustness for what: one or more types of disturbances and/or one or more types of change. A disturbance is external to the system, and occurs at a certain frequency (e.g. extreme rainfall or extremely high or low discharge). A change, on the other hand, can be sea level rise or a development in land use.
Questions that may arise in the analysis of robustness include:
- System robustness: Is our current water system robust enough to withstand rare events (disturbances) such as extreme discharge? Which measures can we use to better prepare our system for such disturbances?
- Decision robustness: Which measure(s) can we take to achieve our objectives in the future – in case climate, land use or values change? Given the uncertainties about the future and the performance of the system, which strategy will enable us to face the future with confidence?
Relationship with other terms
When changes are assessed in the long term, other terms such as flexibility and adaptability also come up. Adaptability to change means that a system, object or strategy can easily be adapted, and/or that a transition can easily be made from one policy to another. ‘Easily’ in this context means that both objectives can be achieved with minimal additional costs and public resistance, but that in order to be responsive, the governing system must have the ability to plan, prepare for, facilitate, and implement the adaptation options (governance). The latter is also called 'adaptive capacity' (see Mens et al., 2012).
Related topics and Delta Facts
Keywords: flood risk, drought risk, vulnerability, adaptation pathways, uncertainty
Delta facts: critical infrastructure, compartmentalisation of the storage basin system
System robustness
Definition
System robustness refers to the robustness of a socio-economic and physical system (of what) in relation to external disturbances (for what). A disturbance may for example be a drought or flood event. A system is robust if it can continue to function during a range of (external) disturbances (Mens et al., 2011). This approach to robustness is derived from the fields of biology, engineering, transport, and computer science, where a system or network is designed such that failure of one component will not result in failure of the entire system. This not only means that the failure is kept outside the system, but that there are mechanisms in place to ward off failure in the system without causing too much damage. An example is a robust railway network where frozen switches will not lead to major disruption of train services.
Conceptually, system robustness can be seen as the inverse of vulnerability (Kwadijk et al., 2006). If vulnerability to high river discharge is low, then the robustness is high. Furthermore, this interpretation of the concept of robustness can be seen as an extension of De Bruijn’s resilience strategies for flood risk management (2005), where she makes a distinction between the ability to keep disturbances outside the system (resistance) and the ability to ward off and quickly recover from disturbances (resilience). For river valleys, resistance means the presence of dikes and enough space for the river to expand over a wider area to accommodate high discharges without this immediately leading to critical water levels. As for resilience, this typically has to do with the resilience of infrastructure, such as compartmentalisation dikes, emergency overflow areas, as well as elevated evacuation routes, distribution centres, hospitals, etc. Current insights suggest that flood risk systems must have a combination of properties to deal with uncertain disturbances. In other words, robust systems with a certain degree of resistance to recurring disturbances and resilience to more extreme events.
Aspects of system robustness
A tool for quantifying system robustness is a response curve that shows the relationship between the extent of a disturbance (in this case, the peak discharge in the river) and the (economic) consequences of this disturbance. Identifying the effects as a function of the disturbance creates an understanding of the most important aspects of system robustness (Mens et al., 2011):
- Response or resistance threshold (the smallest disturbance – in this case discharge - that will cause flood damage);
- Response severity (impact of the flood, such as economic damage);
- Response proportionality (the relative change in damage when the disturbance magnitude increases);
- Recovery rate (how fast the system is able to return to its former state after a disturbance).
The response threshold of a river valley, for example, consists of flood defences that keep the water level within bounds in order to prevent flood events. Discharge peaks that exceed the flood defence capacity may occur very infrequently, but when they do, they inundate the entire area. Response severity refers to the consequences that arise from the flood event, e.g socio-economic damage, casualties, loss of life, and the like. Proportionality reflects the sudden or gradual onset of flooding in an area. The flooding of an entire area as a result of a sudden dike breach caused by a slightly higher discharge wave is not a proportional consequence. Thus, proportionality refers to the possibility of a major disaster. The last aspect of robustness, recovery rate, depends on the following factors: the inundated object, the affected functions, accessibility of the area for evacuation and recovery operations, the area’s economic wealth (are there any reserves?), education and health of the affected individuals, etc.
Enhancing of robustness can therefore be achieved through the following types of measures:
- Preventing damage
- Mitigating damage
- Increasing proportionality
- Increasing recovery rate
Figure 1 shows how the response curve can be used to visualise the effect of measures (see also Field experience). Elevating dikes ensures a higher response threshold; i.e. damage occurs at higher discharges. Creating more space for the river will also raise the response threshold, but lowering the water levels will lead to less damage. Overflow dikes (i.e. dikes that will not fail when they are overtopped by water levels that exceed normative levels) ensure greater proportionality and less damage, although damage occurs more rapidly at higher river discharges. Another advantage of overflow dikes is that they cannot be breached, given that there is more certainty about the discharge level at which a flood event occurs. The response threshold of the other alternatives is very uncertain however, given that failure mechanisms such as piping and instability (sliding) may cause the dikes to fail at lower discharges. System robustness is therefore greater if an event can be anticipated.
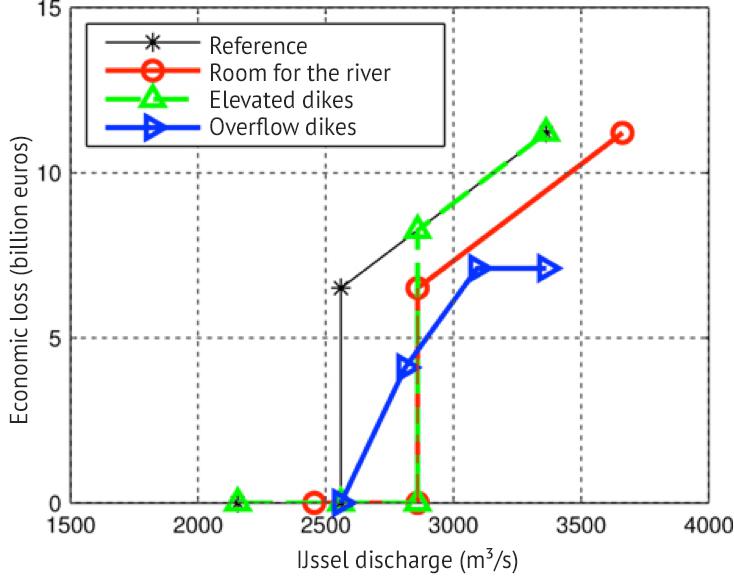
Figure 1. Response curve of the IJssel River valley for different system configurations
Decision robustness
Definition
Decision robustness is the degree to which a measure (i.e. a decision, policy or strategy) performs well under a range of conditions. Robustness therefore is a decision related to the options available between the measures designed for a certain objective. In other words, the robustness of a decision (‘of what’) for future developments (‘for what’). Decisions concerning water management often involve major investments with significant social implications. Thus, we seek to make decisions that will not need to be revisited if the future develops differently than expected. Thus, the questions we need to ask are: what could the future hold, and what can we do now to keep our objectives within reach? This is called robust decision-making and was developed by RAND (Lempert et al., 2003).
Scorecards
One way to determine decision robustness in a future exploration is to use a scorecard. A scorecard shows how a measure or a package selection of measures scores on relevant criteria in each future scenario. Each relevant decision criterion (costs, effectiveness) is analysed in terms of how it varies across the analysed scenarios. A decision on a measure is robust if the cost-effectiveness is high and the variation is more or less consistent across all scenarios.
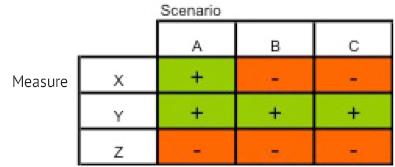
- Figure 2. Example of a scorecard for two measures (Y and Z) and the current policy (X), in three future scenarios (A, B, C). Measure 'Y' is the most robust policy option.
Adaptation pathways
In a scenario-based approach, a measure is evaluated to provide a set of values for climate variables at one or two times in the future, e.g. projection years 2050 and 2100. However, a lot can change between now and the projection years. Meanwhile, the knowledge we have gained and continue to gain about climate change as we evaluate new measurement data and change and adapt the measures (i.e. decisions, policies, and strategies) in response to low or high water levels, as well as conducting analysis of newly introduced scenarios from a more informed perspective, have led to the development of a different approach: tipping points analysis (Kwadijk et al., 2010) and adaptation pathways (Haasnoot et al., 2012).
The adaptation pathway method is summarised in Figure 3, which shows the steps in a combined policy and tipping points analysis, and an adaptation pathway map. An adaptation pathway map identifies the robust policy options for the measures, i.e. the set goals that can be achieved in all the possible future scenarios that have been explored. Some measures are flexible, in that they offer in-built inherent flexibility to move from one measure to another. Moving to a different measure can sometimes be difficult or even impossible. We call this a dead-end measure or lock-in.
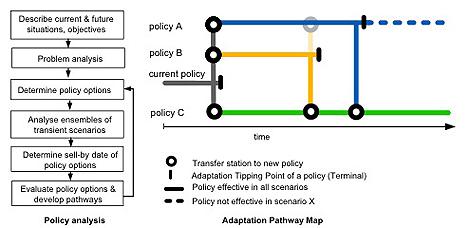
Figure 3. Roadmap for developing adaptation pathways (left) and an example of adaptation pathways (right) (according to Haasnoot et al., 2012).
Relationship with multilayer safety
The multilayer safety approach involves combining different types of measures that work together to protect an area against flood disasters. It comprises three distinct layers:
- Prevention: flood prevention measures
- Spatial planning: sustainable spatial designs that help minimise flood damage
- Emergency response: measures that help keep the number of victims to a minimum
The measures in all layers of the multilayer safety approach can be evaluated for their robustness against uncertainties and change. When analysing system robustness, different combinations of measures can be assessed for their effectiveness in enhancing system robustness against discharge waves. This not only identifies the likelihood of flooding, but also the severity of the consequences if the protection level is breached. In an analysis of the decision robustness against future uncertainties, on the other hand, the packages of measures can be assessed for their effectiveness with respect to future discharges, standards and land use.
Field experience
Robustness is still a very new policy area with little experience to draw on. It is however in line with developments and practices from which experience can be drawn, such as the flood risk and tipping points analyses. Below are some examples of the application of robustness in scientific research.
Robust IJssel River valley
As part of the Knowledge for Climate research programme, the Delta Programme and the Rivers Programme jointly conducted a study on the system robustness of the IJssel River against high discharges (Mens, 2012). Aside from the increased frequency of extreme discharges projected to occur as a result of climate change, extreme IJssel River discharges cannot be predicted with any degree of reliability due to uncertainty about the distribution of discharges across the Rijn River distributaries, the Rijn Waal/Pannerdensch canal and the Nederrijn/Ijssel River Pannerdensch canal. There are also uncertainties about the location of a dike breach and the duration of a discharge wave, thereby creating a broad range of possible consequences owing to flood events. In the study, flood damage was calculated for various events, such as discharge waves with different peaks and duration, and number of (combinations of) breach locations, showing that creating room for the river has a more positive effect on system robustness than elevating dikes, although they both reduce flood risk. Widening the river, however, reduces flood damage for the simple fact that less water flows into the area. Room for the River measures can therefore help increase system resistance without increasing flood damage. It also shows that overflow dikes enhance the effectiveness of system robustness because they eliminate uncertainty about dike failure which allows for better flood forecasting and less flood damage.
Robust policy option for shipping measures
Analysis of decision robustness helps in defining packages of measures for the long-term, using future scenarios about sea level rise and land use change. Exploration of adaptation pathways is described at length in a hypothetical case about a river delta based on the Waal River (Haasnoot et al., in pub.). The objective in this case was to safeguard inland navigation. To achieve this goal, various measures were considered, including small vessels and dredging options, and costing calculations were made for 30 scenarios. The results are shown in Figure 4. ‘Percentage of non-navigable time’ was used as indicator for inland navigation. The objectives in all scenarios are achieved using the small vessels and large-scale dredging options. Small-scale dredging is not a robust policy option, as the objectives cannot be achieved in the most extreme climate change scenarios.
Currently active research
Knowledge for Climate Theme 1
In the Knowledge for Climate Research Programme Theme 1 system robustness is developed for flood risk systems; the main results are described in Field Experience.
Knowledge for Climate Theme 2
In the Knowledge for Climate Research Programme Theme 2 system robustness is developed for a drought risk system. The robustness analysis will identify the measures - which among other things are proposed in the Delta Programme Fresh Water Supply – that will enable the system to better deal with the natural variability in precipitation and discharge deficits.
Perspectives
In the Perspectives Project a team consisting of the Utrecht University, Deltares, UM-ICIS, Carthago Consultancy, KNMI, Pantopicon, and Twente University developed and applied a methodology to identify the most sustainable strategy for water management in deltaic areas with lowland rivers facing an uncertain future. Transient scenarios and a comprehensive meta model (Integrated Assessment Meta Model) were used to explore adaptation pathways.
Delta Programme
The adaptation pathway method is currently being applied within the adaptive delta management approach of the Delta Programme.
Knowledge gaps
Understanding system functioning. Gaining understanding of system robustness requires an understanding of the interaction within the system, i.e. how one component responds to another. Consider, for example, the impact of a dike breach on the downstream water level. Today, most everything is considered from the perspective of subsystems (dike ring parts, dike rings). The interaction between system components can be used to enhance robustness, even under drought conditions.
Robustness of coastal areas and transition zones. Until now, the sole focus of analysis has been robustness of river areas, where high discharges are the main source of disturbance.
But the sea also plays a role in the robustness of transition zones against high water levels caused by combined events (sea storms combined with high discharges). In coastal areas it concerns the robustness against storm surge. How this will play out in robustness analysis has yet to be studied.
Spatial planning in relation to impact reduction and recovery rate. Spatial planning can play a key role in reducing both drought and flood damage. Where flooding is concerned, for example, consider the choice of location for and the smart design of critical infrastructure. In the case of drought, on the other hand, this would involve the crop choice and spatial distribution of crop types. Which measures are possible and what effect does this have on robustness?