 English resume
Effectiveness of Water Intake
The focus in this fact sheet is on taking water in for agricultural (irrigation) purposes and thus on flushing for maintenance of the surface water quality.
|
Thema |
Zoetwatervoorziening, Delta facts, English versions |
|
Tags |
|
|
Downloads |
- INTRODUCTION
- RELATED TOPICS AND DELTA FACTS
- STRATEGY: HOLD, STORE, DISCHARGE
- SCHEMATIC
- PERFORMANCE
- COSTS AND BENEFITS
- TECHNICAL SPECIFICATIONS
- GOVERNANCE
- FIELD EXPERIENCE (NATIONAL AND INTERNATIONAL)
- KNOWLEDGE GAPS
- OVERVIEW CURRENTLY ACTIVE PROJECTS AND RESEARCH
Introduction
Letting water into the waterway systems during periods of insufficient precipitation helps prevent damage owing to rapidly receding ground and surface water levels. Without water intake, agricultural crops, nature conservation and infrastructure, such as peat dikes, buildings and roads, will be exposed to drought and salt stress and sustain damage as result. Apart from level management, water is also taken in for maintaining the desired water quality. In the past, brackish to salt water was frequently let in to the Dutch lowlands to dilute and flush away direct discharges from sewage or industrial effluents. Currently, flushing in West Netherlands is largely designed to prevent high concentrations of chloride from accumulating in surface water as a result of salt seepage. Flushing is by and large, a traditionally established practice, with no defined objectives or service levels. The greatest demand for low-chloride water comes from agriculture. Water is also taken in to prevent cyanobacteria blooms (formerly known as blue-green algae), to control the groundwater level as a means of counteracting peat land subsidence and for preventing dehydration of nature reserves. Flushing places a relatively high demand on water, representing approximately 20% of the total water demand nationwide.
The current practice of taking water in for the benefit of water level management and for flushing purposes is based on diverting significant quantities of river water from other European countries into the Rhine and Meuse rivers. The closure of IJsselmeer, Haringvliet and other lakes has resulted in the expansion of agricultural areas where fresh water can be taken in, for example, by way of the IJsselmeer polders and the Zuid Hollandse Eilanden. However, climate change and the increasing demand for water by different sectors present uncertainties about the availability of water of sufficient quality and quantity for agriculture. To make the right decision about this matter, it is imperative to have a working knowledge of the effectiveness and benefits of water intake. The focus in this fact sheet is on taking water in for agricultural (irrigation) purposes and thus on flushing for maintenance of the surface water quality.
Related topics and Delta Facts
Topics: Water shortage and fresh water supply, level management, irrigation, drought damage, salt damage, water quality
Delta facts: Salt-tolerant crops, soil moisture-based irrigation, brackish seepage.
Strategy: hold, store, discharge
Water intake is a strategy employed to supply water of sufficient quality and quantity.
Part of the Netherlands' current water management policy is focused on ensuring that fresh water of good quality and sufficient quantity is available when and where it is needed. In the Dutch highlands, this is done by distributing the water that flows into our country through the Rhine and Meuse rivers and by using local and regional ground and surface water supplies. In the Dutch lowlands on the other hand, water management is aimed at preventing internal and external salinity and salt-water intrusion from the Nieuwe Waterweg as much as possible, to ensure that under normal conditions, the important fresh water intake points along the Haringvliet, Hollandsch Diep, Spui (Bernisse) and the Hollandsche IJssel remain fresh. The intake water is used for level management, nature conservation and economic purposes such as agriculture, drinking water, industry and energy. Source: National Water Plan, 2010.
Schematic
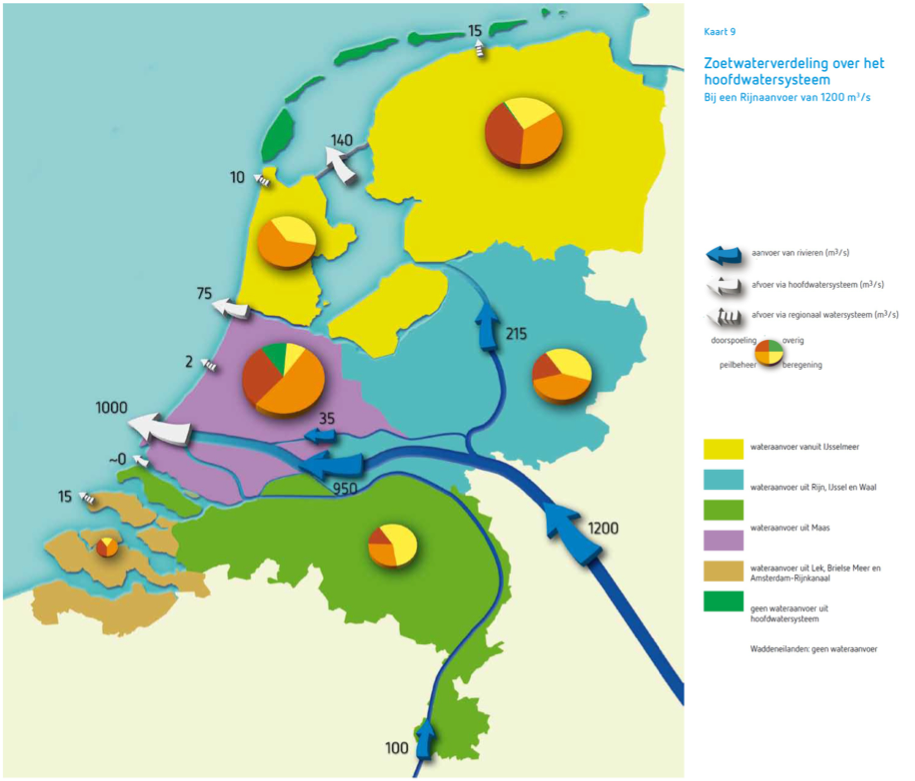
Figure 1. Distribution and fresh water supply from the main water system at Rhine river discharge of 1200m3/s
Source: National Water Plan 2009-2015. Note: The numbers and distribution figures presented here are different from the results of subsequent studies, e.g. Witteveen and Bos (2011)
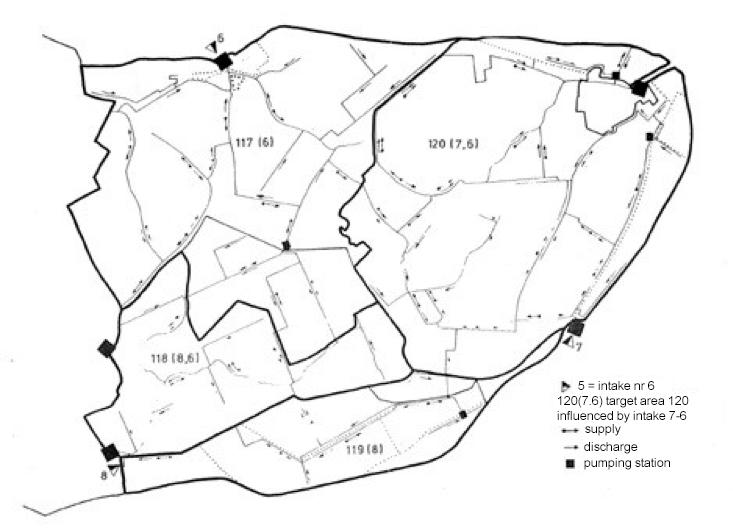
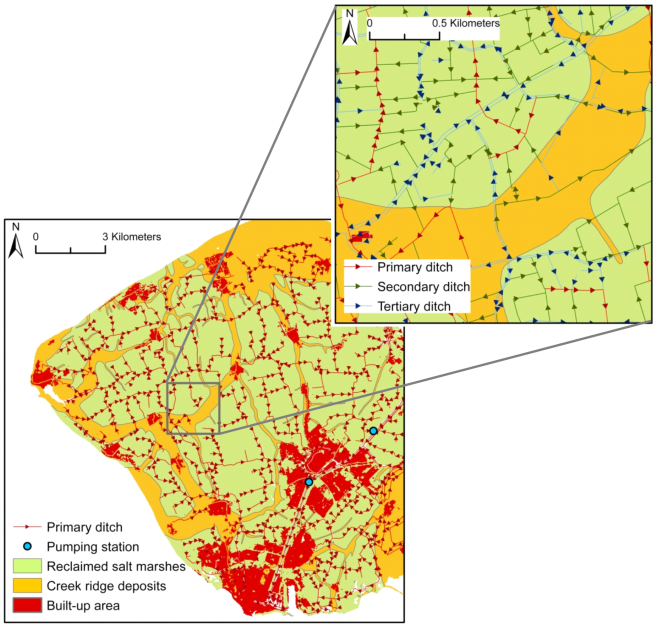
Figure 2. Flushing of sub-areas on Goeree-Overflakkee. Source: Wit 1987. Note: This is an example of an ineffective and inefficient flushing design. Witteveen and Bos have meanwhile proposed better design alternatives.
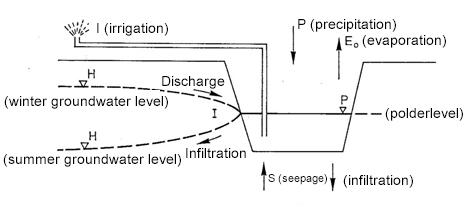
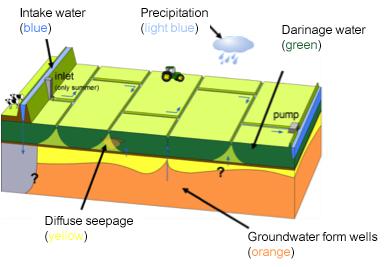
Figure 3. Overview of the factors that play a role in both level management and salt transport
Glossary of terms and definitions
Effectiveness
The key question in assessing effectiveness is whether the taking in of water will help achieve the intended objectives. In this fact sheet, we focus on water intake for agriculture, specifically for irrigation and flushing purposes, with a view to reducing the chloride concentration in the surface water used for irrigation.
Efficiency
Efficiency is determined by the volume of water that is effectively used as a percentage of the volume of water that is taken in. Because of the focus on irrigation for agricultural and flushing purposes, this fact sheet will calculate the percentage as follows: (Volume of water extracted from surface water for irrigation)/(Volume of water let in for irrigation and flushing) x 100%.
To determine the term in the counter, it is necessary to know how much water the users extract from the surface water for irrigation purposes. This information is often not available. Therefore, in this fact sheet we will apply as a measure of efficiency: (Volume of water let in for irrigation)/(Volume of water let in for irrigation and flushing) x 100%.
Performance
The waterway system in the Netherlands was initially built as an overflow to discharge excess water, however, it is also used for water intake, level management or flushing. The intake of water for level management involves quantitative water management, while flushing is aimed at maintaining the desired water quality. Activities relating to level management, however, can have a significant impact on the quality of the surface water, where quality of the water taken in is a determining factor. When maintaining a certain quality of surface water is the objective, both the quality and the quantity of water pursued must meet the requirements to sustain level management and flushing. Especially with regard to level management, where the demand for water is at its highest during periods of precipitation deficit. These periods are characterised by an increased water demand from various sectors while the availability is decreased.
One factor that determines the availability of river water for water intake is the quantity of water used to push back the salt tongue entering the Nieuwe Waterweg. Figure 1 shows the distribution of water across the main system at a Rhine river discharge of 1200 m3/s. Of this relatively low river discharge, 1000 m3/s is diverted to the Nieuwe Waterweg, thereby significantly reducing the water supply available for level management and flushing in sub-areas (Figure 2). This fact sheet does not address the arguments regarding the current allocation policy.
Factors that play a role in both level management and salt transport (see Figure 3 for the symbols used in the text):
Precipitation surplus (P>Eo), which typically occurs in the winter months, causes the groundwater level to rise above the polder level and discharge water (possibly with dissolved salts) into the waterway. In the summer, however, a net precipitation deficit (P<Eo) draws down the groundwater level below the polder level and allows infiltration to take place, resulting in a net water movement from the waterway to the soil. Despite infiltration, however, the topsoil layer may dry out from the lack of rain, forcing farmers to turn to irrigation (I) in order to prevent drought damage. In areas where salt seepage (S) is present, the water in the watercourses may contain such high levels of chloride that it creates the perfect conditions for salt damage to occur. Flushing can help prevent this (see Figure 3). Moreover, a recent study concludes that runoff from salt wells in deep polders accounts for upwards of 50-60% of the total salt load on the surface water system (Louw et al., 2010, 2011, 2013). A further complicating factor, aside from salt seepage, is that the chloride content in the watercourses may also rise due to the leaching salts that have accumulated in the top layers of the soil. This transport occurs only during periods of precipitation surplus. Consequently, intake water may still be necessary to flush the waterways, even during a wet summer: all in all, a complex, dynamically linked water system.
Flushing performance (see Figure 2):
The desired water quality in a sub-area depends on the crops in that area, where, in principle, the most salt-sensitive crop is typical of the area. On the one hand, the flushing requirement depends on the transport of chloride to the ditches via salt seepage and from the plots under the influence of weather conditions (see Figure 3), and on the other hand, on the concentration of the intake water and the hydraulic properties of the waterway system (Figure 2). Complicating factors include: 1. Under the influence of topography, soil conditions, land use and weather conditions, salt water discharged from one plot could simultaneously infiltrate another plot in the same sub-area on the watercourse; 2. A measuring device is typically lacking to determine intake flow rate; 3. The many distributaries and changes in geometry of the waterways make flushing inefficient and difficult to model, especially at certain points where discharge and supply occur in opposing directions (see arrows in Figure 2).
Effectiveness of flushing
Effectiveness is defined as the extent to which objectives are achieved by means of implementing certain measures. In polder areas affected by salt seepage, more water is taken in than strictly necessary for level management and irrigation, as the objective is to keep the surface water as 'fresh' as possible. The text below is excerpted from the Delta Programme report Fresh water supply in the Southwest Delta and Rijnmond-Drechtsteden (Visser et al., 2011). A number of remarks are provided below the textbox.
|
Box 1: Critical indicators for water supply in areas affected by salt seepage (quote from Visser et al., 2011; p. 49) The quality and intensity of the seepage and the quantity and chloride content of the intake water serve as the basis for determining the measures necessary to keep the system ‘fresh’. The higher the chloride concentration, the greater the quantity of water that initially needs to be taken in. Beyond a certain concentration, it is not possible to achieve the necessary (normative) concentration in the ditches. In the current situation, the concentration of chloride in the water taken in varies between 50 and 300 mg/l. In normal situations, this is sufficient to meet the demand from agriculture, i.e. the quality is sufficient as and when the demand arises. To maintain this system it is essential to ensure that:
Indicators include:
|
Remarks with regard to box 1:
"To maintain this system it is essential to ensure that the concentration of chloride in the watercourses does not exceed the threshold value for the crops during the growing season"
Threshold value is a term derived from the PAWN study conducted in 1982 (see fact sheet on salt-tolerant crops). It is the chloride (Cl) concentration above which the yield is assumed to decrease linearly as the concentration increases. An example: the threshold value for fodder maize is 217 mg Cl/l and the yield decreases by 3.43% per each additional 100 mg Cl/l. This example indicates that strict adherence to the specified threshold values is not always necessary. Stuyt et al., (2011) therefore advocate abandoning previously accepted salt standards:
'sufficient water can be supplied to flush the watercourses in the entire area.'
Flushing occurs when the water in the watercourses is replaced by intake water. The flushing process is most efficient when it takes place in a straight waterway without distributaries, with an intake on one side and an outlet on the other, and a uniform gradient in the direction of the outlet. This could not be more different from the situation in polders with multiple distributaries, variable geometry and soil gradient, and blind ditches (see Figure 2). Recent measurements using gadolinium as a tracer show that intake water does not penetrate small waterways as deeply as previously assumed (Figure 4).
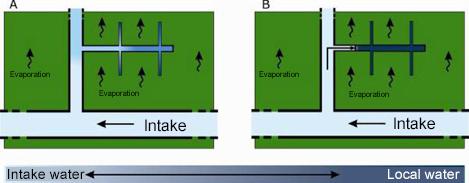
Figure 4.The distribution of intake water with high evaporation rates in dry periods. (A): previous conceptual model: intake water mixes with local water and penetrates through to the 'capillaries of the surface water system'; (B): current conceptual model: less mixing, intake water 'pushes' local water back into the capillaries.
Source: Siderius et al., 2011
How deep the intake water penetrates the capillaries of the surface water system strongly depends on the geometry of the system, the location of the capillaries with respect to the intake point (e.g. Hendriks, 1990; Van Gerven et al., 2011), as well as the local infiltration requirement. Using model calculations, Hendriks (1990) illustrated that the intake water penetrates the capillaries less deeply in (sub-)areas affected by seepage than in (sub-)areas subject to infiltration.
The former conceptual model also proved that the agricultural land that can effectively be flushed is smaller than the land under level management which, according to the ICW study on the flushing need of Goeree Overflakkee (GO) and Voorne Putten (VP), was an average of 80%, and between 30-100% for sub-areas within these islands (Querner 1988). The same study found that during certain periods the standard could not be met in areas with high chloride concentration (> 2000 mg/l) as a flushing intensity of more than 0.5 l/s/ha would be required. The percentage of the land where the standard could not be met varied between 50 and 100% per sub-area.
Efficiency of flushing
Averaged over the entire research area of the ICW study, the water supply capacity required for salinity control* was of the same order of magnitude as the water supply required for irrigation. However, about five times more water was required for flushing GO and VP than for irrigation (Figure 5), and even more than 20 times for some sub-areas, yet the chloride standard could not be achieved at all locations within the sub-area (White 1987). Based on the efficiency standard applied for the purposes of this fact sheet (see Schematic), this is about 50% for the entire research area (RA), with an average of 16% for the entire agricultural land on GO and VP, and 5% in some sub-areas.
*) The ICW study drew a distinction between two mechanisms of surface water salinity: (1) direct supply through salt seepage and (2) indirect supply from the plots. The second component is weather-dependent, hence the distinction made between flushing (continuous) and salinity control (weather-dependent).
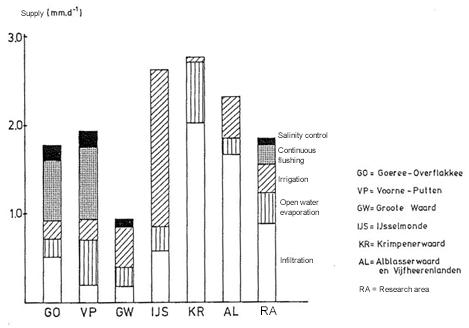
Figure 5. Distribution of the typical water supply need, calculated for the land use situation in 1983. Source: Wit 1987
For the Knowledge for Climate Programme [Kennis voor Klimaat Programma], the water supply need for Southwest Delta is calculated (Vries et al., 2009) using the Netherlands Hydrological Modelling Instrument (NHI)and different and larger units than applied in the ICW study. The results are also presented in a different manner (Figure 6), in that the respective figures do not readily lend themselves to comparison. However, it is clear that the quantity of water (intake) for flushing purposes is many times greater than the quantity of water for irrigation: about 30 times as much for Voorne Putten and slightly less than 20 times as much for Goeree Overflakkee, equalling an approximate flushing efficiency of 3% for VP and 5% for GO. This means a loss of efficiency compared to the efficiency level reported in the ICW study of 1983 (16% for both VP and GO). The increase in internal salinity arising from the rise in sea level was also expected to increase the required quantity of water intake by 40%, which currently has been adjusted down to 25% (Delta Programme, 2011).

Figure 6. Components of the water balance for the summer period, situation in 2003 Source: Vries et al. (2009)
Flushing and irrigation in practice
Recent surveys find that large differences exist between the water boards in terms of the extent to which salt is regarded as a problem and in the approach used to solve it. Stuyt et al., 2011; Witteveen and Bos, 2011).
Costs and benefits
Water intake comes at little financial cost to the water manager, given that the existing infrastructure is used, which was originally built for drainage, after all. The low flushing efficiency presents a drawback, however.
The water system charges differ significantly from water board to water board (Table 1). The per-m3 cost price for water from the agricultural water line or tap water is much higher than the water system charges (Table 2).
| HH Delfland | €137,51/ha |
| WS Hollandse Delta | €79,73/ha |
| WS Zeeuwse Eilanden | €59,71/ha |
| WS Zeeuws Vlaanderen | €62,76/ha |
| WS Brabantse Delta | €31.19/ha |
Table 1. 'Unbuilt water system charges' by various water boards. Source: De Vries et al., (2009)
| Fresh water supply | Cost price |
| Water system charges | €0.02/m³ |
| Reigersbergse polder | €0.15/m³ |
| Pilot area ZO-Tholen | free |
| Land consolidation interest | €0.10/m³ |
| Agricultural water line | €0.02/m³ |
| Schouwen, April 2007 | €1075/ha |
| (One irrigation cycle 22mm) | €5.00/m³ |
| Hidden costs of VZM fresh waterlake | €1.50/m³ |
| Tap water | €1.50/m³ |
Table 2. Differences in the cost price of water. The high costs incurred at Schouwen-Duiveland are a one-time event where water is supplied by tankers. Source: De Vries, et al., (2009)
Both the effectiveness and efficiency of water intake are found to vary significantly from one location to another, posing problems when users demand a certain water quality when and where they need it. A demand that water managers cannot possibly meet due to the inadequacy of the infrastructure and the lack of sufficient water intake in some periods. This situation does not occur in current practice: of all agricultural land in the Netherlands, 19% is under irrigation, with 14% in Southwest Delta (The State, 2011). It also poses less of a problem when water managers and users want and are able to come to an agreement about the locations that will be provided with water of sufficient quality and quantity in the next growing season. This requires consultation and flexibility on both sides, as well as a high degree of solidarity among the users to reach agreement on a skewed distribution of costs and benefits, as some locations require much more water and/or much more effort is needed to deliver a sufficient quantity of water to some locations than others. It also requires regional and crop-specific knowledge for developing workable solutions. There are also significant differences between the users in the irrigated area, the extent of irrigation and the required water quality, making it virtually impossible to provide an accurate quantification of the costs incurred by the water manager in respect of each individual user.
Accessible fresh water supply monitoring tool
The €ureyeopener is an accessible tool that provides fast and interactive access to information about the current fresh water supply for a region or (part of a) catchment area and offers different approaches for distributing fresh water in times of water scarcity. Following development of the €ureyeopener version 1.0 for the management area of the Rijnland Water Board (Stuyt et al., 2012), the tool was further developed for Southwest Delta and the Rijnmond Drechtsteden regions (Schipper et al., 2014) in support of policy development for the sub-programme Delta Fresh water Programme. Water managers hope to gain a better understanding of the effects of the current fresh water supply on the benefits in agriculture and identify appropriate and cost-effective measures to make the fresh water supply future-proof. The tool provides useful and clear answers to knowledge questions about the regional fresh water supply. The added value of €ureyeopener 2.0 is its ability to provide fast and interactive access to information about the effectiveness of potentially attractive options for the fresh water intake system by calculating the water and salt balance, translating the effects on agriculture into yield changes and making the effects of the measures immediately transparent by creating an accurate breakdown of costs and benefits. Additional location-specific figures have been collected for calculating the costs of a number of measures.
Technical specifications
A basic condition for water intake is the availability of water of sufficient quality and quantity. Figure 1 shows that excessive demands are placed on water supplies during periods of low river discharge, such as is the case in dry summers. Due to the effects of climate change, the demand for water is expected to exceed supply (Vries et al., 2009). To ensure effective management, it is necessary to set and communicate clear and feasible goals, with equally clear agreements on liability for failure (inability) to achieve these goals.
Effective management also requires a supply system of sufficient capacity. For efficient management, it is essential that intake volumes of water are continuously measured and recorded. Currently, these conditions are not being met anywhere in the Netherlands.
Governance
A complicating factor is the coexistence of public and private water supplies, with vastly different service levels and rates. Another complicating factor is the uncertainty over the quantity and quality delivered, which is reinforced by recent investments by farmers banking on having access to water of sufficient quality when and where they need it.
Field experience (national and international)
Flushing in the Netherlands was applied as of the late 1900s as a means to improve the water quality of canals in the cities. Flushing for purposes of salinity control in agricultural lands occurred later. Van den Noort (2003) shows that costly studies needed to be conducted in respect of both practices before a decision could be made on building facilities such as the ‘Ververschingskanaal’ [drainage canal] (1888) and the Brielse Meer pipeline (1988). The quantity of water required and the effectiveness of the measure was a continuously recurring issue of controversy.
While there is extensive international literature available on flushing salt from irrigated agricultural lands in dry regions, there is no known international literature on the flushing of waterway systems that are salified as a result of salt seepage; however, in recent years we have started building a nationwide file on the interaction of fresh and saline water in an interconnected ground-surface water system. The file explicitly cites the doctoral dissertation of Joost Delsman (Deltares, Knowledge for Climate Programme, 2010-2014), who illustrates the impact of flushing on salt concentrations in the ditch water in the southern part of the Haarlemmermeer polder, for example (Delsman et al., 2013; 2014). The surface water system recharges at a rapid rate (Figure 7).
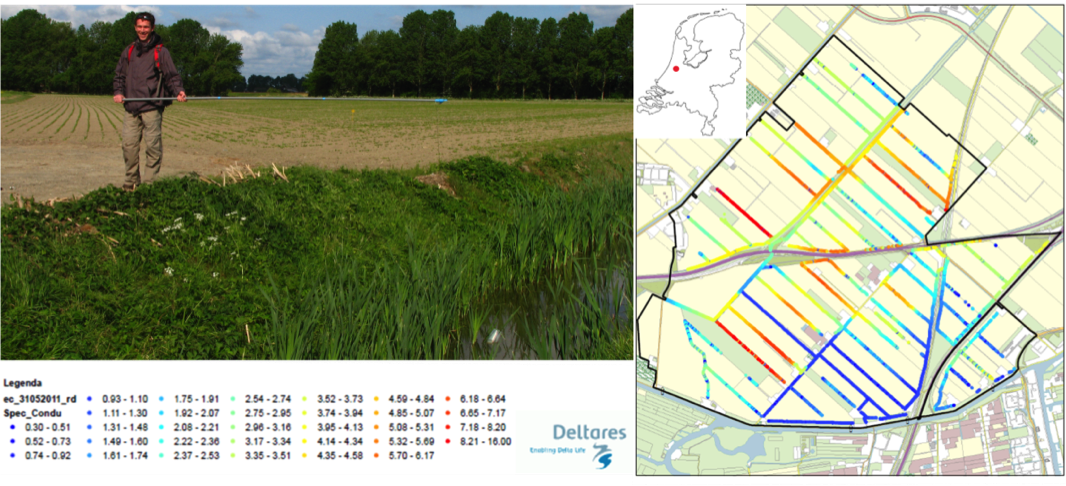
Figure 7. Chloride concentration measurements (in terms of Electrical Conductivity, EC) in a fixed drainage level area of the Haarlemmermeer polder: the flush water reaches a much smaller section of the area than expected. The inlet in the southeast consists of (blue) fresh water, however, just a few hundred metres away, the fresh water taken in has become too saline for irrigation due to the salt wells in the surface water. A diffuse rendering of the spatial image does not reflect the actual situation, but the salinity of the surface water varies from ditch to ditch.
On a larger scale, we studied the flushing/salt damage relationship in the Rijnland management area. The study found significant spatial differences in flushing effectiveness: flush water enters only a small section of the area, quickly increasing the salt concentration as it recharges while moving through the ditches (through salt wells). Much of the same water is sometimes used repeatedly. Whether flushing actually increases the demand for water depends primarily on the distance to the inlet. Thus, we advocate integrating ‘salt’ and 'flushing' into local processes: it is time to use 'salt' as a guiding principle! This will lead to tailor-made solutions at both local and regional scales: differentiated requirements/standards/expectations regarding accumulated salt concentrations that may vary throughout the year for agriculture and nature, thereby allowing:
- Salt-sensitive crops/salt-tolerant crops to be grown close to/farther from an inlet;
- Farmers to benefit from specific and accurate knowledge about the expected salt concentrations, eliminating the need to demand a certain water quality when and where they need it;
- Farmers and water boards to consult closely about irrigation periods and expected intake intervals so that the available water can be used as efficiently as possible during periods of scarcity. Or at a higher abstraction level: is it possible to develop an optimised crop rotation system that would minimise the peak water demand in a sub-area?
Knowledge gaps
A recent study by Deltares concludes that:
'We were unable to obtain a clear picture of the exact efficiency of the present fresh water supply system due to the lack of access to verified water balances of all sub-areas in the Netherlands, nor were we able to establish the cost-effectiveness of the current policy.' (Klijn et al., 2010). Verification of water balances requires accessibility to measurement data on all intake points. Figure 8 shows that this is currently not the case.
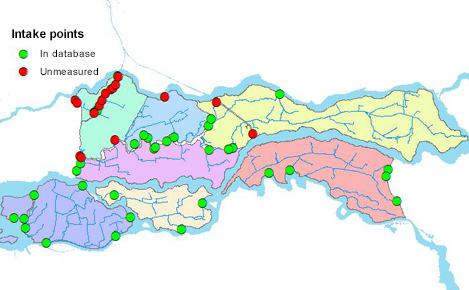
Figure 8. Measured and unmeasured intake points in Rivierenland. Source: van Boekel 2011
Key action perspective of regional water manager: "Screen the flushing policy for the areas by conducting an effective area analysis". Consequences:
- Increase focus in climate adaptation on local solutions in consultation with farmers (and conservationists). This is more effective than investing in a larger supply of flush water.
- For long-term adjustments, develop a spatial plan that is geared towards the saline situation in an area.
What can water managers do based on current knowledge?
- Map out the water system;
- Map out the assumed damage so that costs and benefits of the measures taken can be considered in terms of money;
- Engage water users in dialogue about service levels;
- Incentivise user self-sufficiency or land use adjustment in areas that cannot be supplied with sufficient fresh water;
- Use knowledge of the water system to influence decisions on spatial planning;
- Examine critical local situations together with farmers and study the effects of their water management measures.
Overview currently active projects and research
| Research Project | Links/documents |
| Netherlands Hydrological modelling Instrument for fresh and saline water | https://publicwiki.deltares.nl/display/ZOETZOUT/Landelijke+studies |
| Delta Programme | http://www.narcis.nl/research/RecordID/OND1343822/Language/en |
| Climate-Proof Fresh water Supply and Hotspot Rotterdam | www.kennisvoorklimaat.nl |