
 English resume
Monitoring of biological outcomes of river restoration (COSAR)
It is crucial to assess the effectiveness of restoration measures and the achievement of environmental and ecological targets in stream and river restoration projects. However, monitoring of such projects is often lacking due to limited resources and familiarity with the monitoring setup. In this Deltafact facsheet we provide an overview of existing monitoring designs and summarise the advantages and disadvantages of each approach. We also give an overview of different methods for exploring ecological data derived from monitoring programmes.
|
Thema |
Waterkwaliteit, COSAR: Improving the ecological status of rivers |
|
Tags |
|
|
Downloads |
1. INTRODUCTION
2. RELATED TOPICS AND DELTAFACTS
3. STRATEGIC CONTEXT
4. GRAPHICAL ABSTRACT
5. CONTENT
6. COSTS AND BENEFITS
7. SPECIFIC CONDITIONS
8. GOVERNANCE
9. EXAMPLES OF (PRACTICAL) APPLICATIONS
10. KNOWLEDGE GAPS
1. Introduction
It is essential to assess the effectiveness of restoration measures and to determine of environmental or ecological targets in stream and river restoration projects are achieved. This allows fine-tuning or adapting restoration measures, and applying insights from previous projects in future projects. Furthermore, availability of monitoring results facilitates communication with internal and external stakeholders. Also clearly explaining why certain measures are taken, and what their expected impacts are is important for gaining support for implementation. However, despite its relevance, monitoring of stream and river restoration projects is often lacking (Dos Reis Oliveira et al., 2020, https://doi.org/10.1016/j.jenvman.2020.110417). This gap is commonly explained by insufficient availability of resources and a lack of familiarity with setting up monitoring programs.
Effective project-based learning in restoration initiatives requires documentation of the restoration process steps and the subsequent environmental and ecological changes in the river ecosystem. The purpose of this Deltafact is to facilitate this process. It helps water managers involved in stream and river restoration in choosing the appropriate monitoring design and biological parameters to assess their projects' ecological effectiveness. Our recommendations aim to optimize future monitoring designs, establishing causal relationships between restoration measures and biological outcomes.
2. Related topics and Deltafacts
Deltafacts
- Ecological monitoring (in Dutch)
- Strategies for assessing the effectiveness of stream restoration projects (in Dutch)
COSAR Deltafacts
- Factors contributing to successful river restoration
- Legacy effects affect river restoration outcomes
- DAPSIR: a predictive model of river restoration outcomes
- Use of social media data in river restoration
3. Strategic context
Since the establishment of the Water Framework Directive (WFD) there has been a considerable effort to standardize biological monitoring of European freshwaters. This effort has resulted in guidelines for measuring a specified set of parameters using standard methods at fixed measuring points at certain frequencies (Hering et al., 2004, https://doi.org/10.1023/B:HYDR.0000025255.70009.a5). This systematic approach has been widely adopted among EU member states and involves the integral measurement of various biological, hydromorphological, and physico-chemical parameters at designated sites.
While this method establishes a baseline understanding of a river's ecological water quality, it often fails to capture the dynamic and complex nature of aquatic ecosystems. To determine the effectiveness of restoration measures, a more targeted monitoring approach is needed that accounts for other environmental factors influencing the ecosystem and goes beyond generic water quality assessments. Ultimately, this approach should result in a more refined, scientifically robust monitoring approach that better captures the effects of restoration efforts and supports effective water management decisions.
4. Graphical abstract
Not applicable.
5. Content
Which monitoring should be implemented to collect the necessary information?
Different monitoring designs can be used to determine the effects of stream and river restoration measures on ecological and physical-chemical parameters, among others (Figure 1). The extent to which the results can be associated with the restoration measure (i.e., the causal relationship) and the statistical reliability depend on the chosen design.
Before/After-Control/Impact
The most reliable design for determining the causal effects of restoration is the before/after - control/impact (BACI) design (Stewart-Oaten et al., 1986; https://doi.org/10.2307/1939815). Measurements are carried out multiple times before and after the measure is applied in the section of the stream or river to be restored, as well as in one or more control sections. A control section has characteristics similar to those of the section to be restored, e.g., in terms of hydromorphological conditions and species assemblages. However, finding suitable control sections is often challenging because of the environmental heterogeneity present in most river systems. In practice, upstream sections close to the section to be restored (but not impacted by the applied measures) are often the most suitable option.
The BACI design corrects for the initial state (e.g., community composition before restoration) in the section where the measures are implemented, as well as for changes unrelated to the measures (e.g., weather-related flow differences) that occur over time in the control section. To acquire reliable results, it is advised to measure at least three times before implementing the restoration measures and at least four times after applying them.
Because ecosystems may respond slowly after restoration, it is advisable to measure over a longer time period (Smokorowski & Randall, 2017, https://doi.org/10.1139/facets-2016-0058). For water managers, this means that, to apply this design effectively, they must start the monitoring program well before implementing the measures and plan for a long monitoring period afterwards. For example, measurements should take place in the years -3, -2, -1, 1, 2, 5, and 10.
Before/After
In some cases, control sections are unavailable. In such situations, the before/after (BA) design could be a solution, with measurements taken before and after the restoration implementation. The reliability of a time series analysis depends on the number of measurements carried out over time. In this case, it is crucial to have a sufficient number of measurements before implementation to capture potential variations (e.g., in community composition) in the system and determine the effect of the restoration measure.
However, this design is vulnerable to detecting changes unrelated to the measure because all changes in the studied parameter after restoration are attributed to the measure. Unlike the BACI design, no correction by the control can be carried out. Therefore, it is recommended to sample multiple locations within a catchment area using the multiple before-after (mBA) design, which enables you to account for spatial and temporal differences resulting from changing environmental conditions over time.
Control/Impact
Finally, the effectiveness of the measures can be determined by comparing sites where the measures have been implemented with sites that have the same characteristics and are unrestored. This is the multiple control-impact (mCI) design. This design corrects for effects unrelated to the measures by cross-comparing a series of restored-unrestored site pairs. However, this makes the design vulnerable to small sample sizes. Furthermore, it does not provide insight into the development of the effects of the measures or changes in assemblage composition over time. This limitation can be overcome by selecting sites that vary in the time since implementation of the measure (the so-called "place-for-time substitution") or the extent of the intervention. This allows one to determine correlative relationships. One advantage of this design is that it can be used after the measure has been implemented. With multiple restored-unrestored pairs for a certain measure, insight can be gained into the generic effects of the measure.
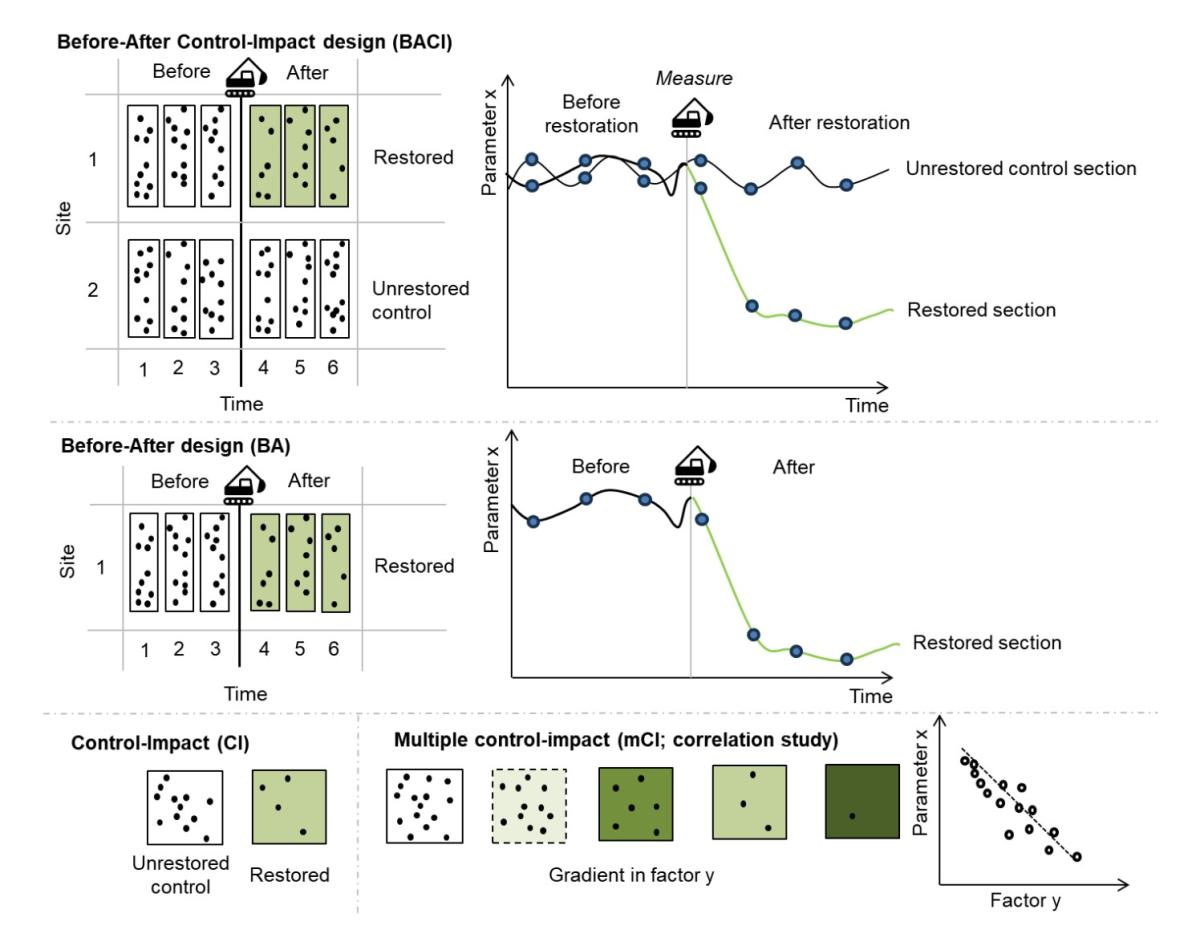
Figure 1: Monitoring designs that can be used to determine the effects of restoration measures (Verdonschot et al. 2020, The change over time of parameter x is measured before (B) and after (A) the application of the restoration measure. The BACI design contains a restored impact location (I) and an unrestored control location (C), where measurements are carried out before and after the measure is implemented. In the BACI design, measurements are taken only at the impact location. In the CI design, measurements at the impact and control locations are compared. In a CI design, to determine the effect of parameter x, multiple impact locations (mCI) that vary in factor y can be compared, which allows you to correlate the effect to the observed change.
How can the effects of restoration be determined based on the collected data?
After field sampling and processing, there are several ways of analysing the acquired data. Here were present two widely applicable approaches: assessing effects based on temporal response curves and using effect sizes to determine the magnitude of the change according to the pre-restoration state.
Temporal response curves
One option is to compare the temporal response curves of a restored site and its unrestored control for a metric of interest, for example, comparing species assemblages of restored and control river sections. This approach provides information about the extent to which a restored site diverges from the pre-restoration state and whether it reaches a specific reference or target state (the restoration goal) over time (Figure 2). An example could be found in Verdonschot et al. (2015) https://doi.org/10.1111/fwb.12479. However, such a spatio-temporal comparison can be limited methodologically, as it requires a BACI design, as well as a long time series of data. Furthermore, it is limited in its ability to provide generalized patterns across a large number of sites.
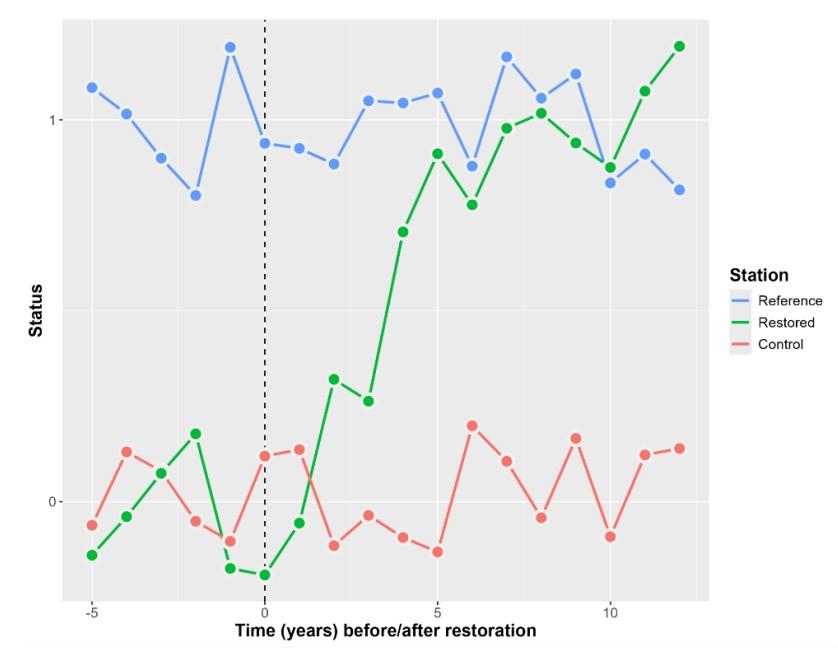
Figure 2. Theoretical illustration of temporal response curves showing how the status of a restored site (based on a given metric) diverges from an unrestored, ecologically degraded control site in order to reach the status of a "reference" site (with the highest ecological status) after restoration.
Effect sizes
To address the limitations described for temporal response curves, another approach focuses on "effect sizes" of restoration measures. This provides a direct estimate of the amount of change in a given metric relative to the pre-restoration state (Figure 3). The Log-Response Ratio (LRR) is often used, amongst other available methods, because it:
- is appropriate when outcome measurements are all of the same sign (e.g., diversity metrics and abundances are all positive);
- allows comparison of unstandardized measurements, e.g., with different units, biological groups, and designs;
- can be quickly back-transformed to a percentage of increase or decrease, making it more useful for management purposes.
However, the downside of this effect-sizes-approach, as opposed to the response curves mentioned above, is that information on the initial and final values of the metric used is lost during the calculation process. Therefore, keep in mind that a high effect size does not mean that a near-natural state has been reached, only that there is a large difference between pre- and post-restoration state.
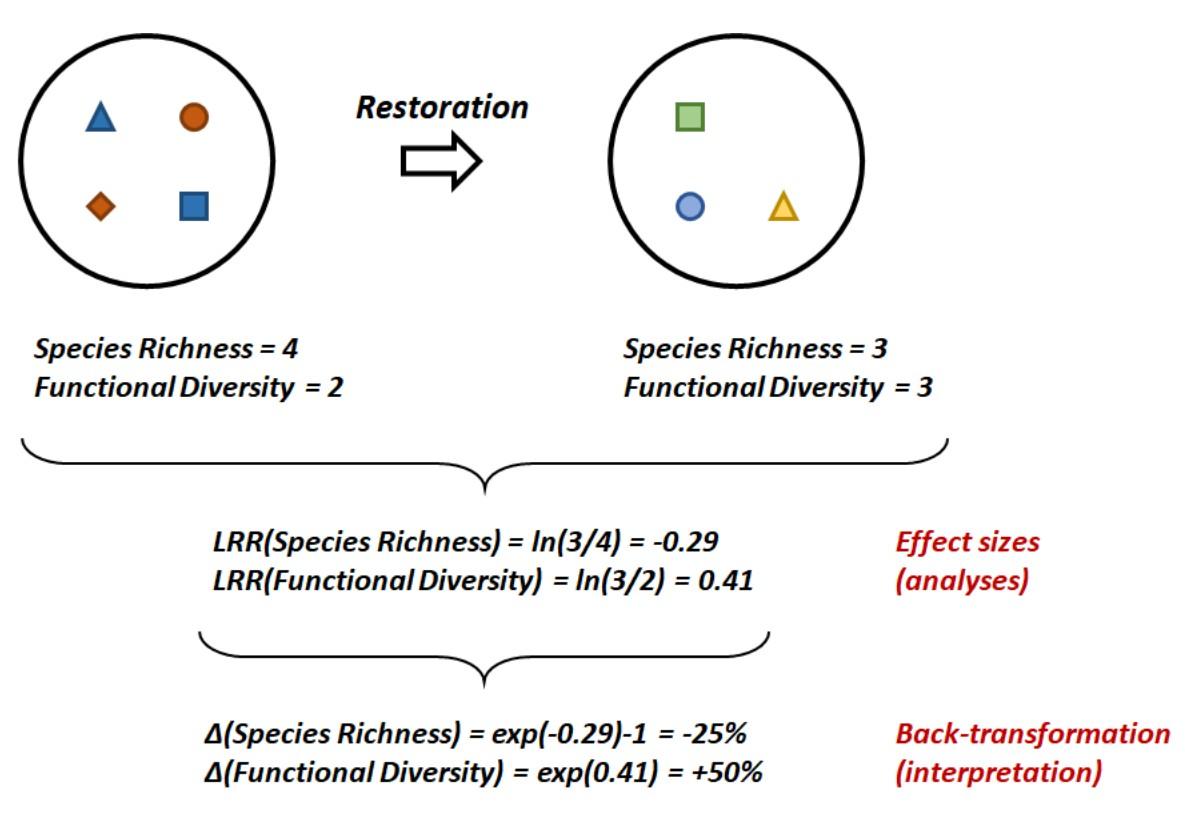
Figure 3. Conceptual illustration of how effect sizes based on species richness (shapes) and functional diversity (colors) are calculated using the log-response ratio for statistical analyses, and potentially back-transformed to ease interpretation of the values.
6. Costs and benefits
The choice of a specific monitoring design significantly impacts the type of data that will be collected, and should be tailored to the project's specific goals. However, there is often a trade-off between data collection and feasibility in terms of monitoring effort and associated costs. Table 1 provides guidelines to help choosing an appropriate design, as each design has its own strengths and weaknesses. In general, BACI (Before-After-Control-Impact) designs are statistically rigorous and useful for isolating the effects of interventions by comparing data from restored and unrestored control sites before and after restoration. However, application requires considerable monitoring effort. BA (before-after) designs are simpler, but still valuable for assessing changes over time, especially when considering multiple sites. CI (control-impact) designs are less robust, but useful when pre-restoration data is unavailable.
Table 1. Description of the trade-offs between the BACI, BA, and CI designs.
| Method | Trade-offs | Sampling effort | When to use | |
|---|---|---|---|---|
| Strengths | Weaknesses | |||
| BACI (Before-After-Control-Impact): compares data from before and after the intervention at both restored and unrestored control sites. | Provides strong evidence of intervention effects by isolating changes due to the intervention. Accounts for natural variability. | Requires at least two sampling sites and multiple data points, which increases complexity and associated costs. Sufficient available data must be collected before start restoration to establish a baseline with at least three time points. Suitable unrestored control sites are needed. Finding suitable controls could be challenging. | High effort: Requires extensive data collection over time and across multiple sites, which can be resource-intensive. | Use it when you need the most robust assessment of intervention effects. |
| BA (Before-After): compares data from before and after the intervention at the restored site(s). | Simpler and less costly than BACI. Provides clear before-and-after comparisons. | Less robust than BACI. It does not account for natural variability or external factors due to a lack of control. | Moderate effort: It requires detailed data collection at intervention sites over time, but fewer sites than BACI. | Use this method when control sites are unavailable or when resource constraints limit the number of sites. |
| CI (Control-Impact): compares data between restored sites and unrestored control sites without pre-intervention data. | Useful when pre-intervention data is unavailable; can still show differences between restored and unrestored conditions. | Less robust than BA and BACI, because it lacks baseline data and cannot definitively attribute changes to the intervention. | Lower effort: It requires data collection at control and impact sites, but not pre-intervention data, making it less resource-intensive. | Use it when pre-intervention data is unavailable or when quick assessments are needed. |
7. Specific conditions
Depending on the project objectives and/or research questions, different biological metrics and indicators are available to determine restoration outcomes. Basically, national and transnational Water Framework Directive (WFD)-compliant indices (e.g., Ecological Quality Ratios) can be used to measure improvement in the ecological status of water bodies following restoration. However, while such indices may be mandatory in a regulatory context, they provide little information about the actual responses of biological communities to environmental changes.
Consequently, biodiversity metrics based on species richness and abundance have historically been used — and still are — to assess restoration outcomes. These metrics can be calculated at the community scale to provide an average value for the whole community. Alternatively, the emphasis can be placed on particular taxa of interest (e.g., indicators, desirable or undesirable species, habitat specialists, rare or endangered species, or invasive species) within biological communities.
Beyond any empirical classification of species, one strategy is to focus on the specific biological and ecological attributes of taxa, known as "functional traits," with respect to restoration objectives and expectations (e.g. Schmidt-Kloiber & Hering 2015). For example, the relative abundance of feeding groups can indicate potential changes in food resources after restoration measures are implemented. One such measure is the establishment of a woody riparian corridor along a stream, which increases organic matter. Similarly, when diversifying a habitat by recreating riffle-pool sequences, one would be interested in the response of species richness in fast-flowing versus still waters, also known as rheophilic and limnophilic "guilds," respectively.
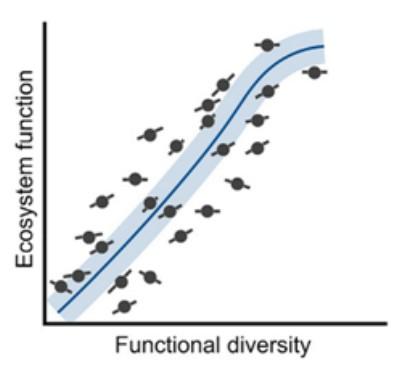
Finally, the scope can be expanded to include a larger number of traits expected to be influenced by restoration. These include organism size and form, life history and reproduction, feeding group, habitat preferences, dispersal, and mobility. Although gathering trait information requires effort (it is available in databases such as www.freshwaterecology.info), a functional characterization of organisms enables the computation of "multidimensional" diversity metrics (e.g., functional richness and functional rarity), which are considered to be more directly related to ecosystem processes and functioning (Schmitz et al., 2015, Figure 4). This is the ultimate outcome of restoration.
8. Governance
To assess the effectiveness of restoration, it is crucial to establish and integrate monitoring early in the project planning process. This ensures that the monitoring program is in place before restoration measures are applied, and that it continues in the years after restoration. Ideally, measurements would start at least three years before restoration. Conducting baseline measurements well before implementation provides a robust foundation for accurately evaluating the measures later on, after post-restoration measurements have been carried out. Therefore, the early involvement and long-term commitment of all stakeholders is needed. Securing funding for project monitoring and addressing aspects such as data availability and storage are important considerations.
9. Examples of (practical) applications
During the process of gathering biological monitoring data at restored sites for the COSAR project, data on fish communities at 37 sites across Europe were collected. Restoration measures consisted of revegetating stream banks and creating buffer strips. On average, fish species richness increased by about 30% after restoration at these sites. At first glance, this change may seem like a positive outcome of revegetation. However, this does not indicate the types of species promoted by the restoration. Not all species are expected or desired to benefit from a given measure. Under certain circumstances, however, very generalist and tolerant species (also called eurytopic species), including some invasive species, are the most responsive to restoration. In the case of revegetation, shading and purification are important processes targeted by restoration, which are expected to have positive consequences for water cooling and quality. Therefore, it is more relevant to focus on fish species that are typical of cold waters (the stenothermic guild) and those that are vulnerable to water quality degradation (the sensitive guild) than on the entire community. At the 37 revegetated sites, this approach revealed an average increase of 60% and 50%, respectively, in species richness, which lends more weight to the relevance of the restoration measure.
Additionally, replicating monitoring samples over time can provide information about the temporal dynamics of such structural and compositional changes within biological communities. For example, the temporal evolution of the restoration effect size for the stenothermic guild at the 37 revegetated sites revealed an increase in species richness and density during the first ten years after restoration, followed by a plateau (Figure 5). In other words, more species and individuals were observed in the first decade after restoration than in the initial state. However, while both components stabilize beyond this time window, functional diversity in fish communities gradually increases over the entire 17-year dataset period without plateauing (Figure 5). This pattern indicates that within a constant pool of species and total number of individuals, reorganization occurs so that different functional features are more equally represented in communities. This supports greater biodiversity and consequently better ecosystem functioning (see Figure 5).
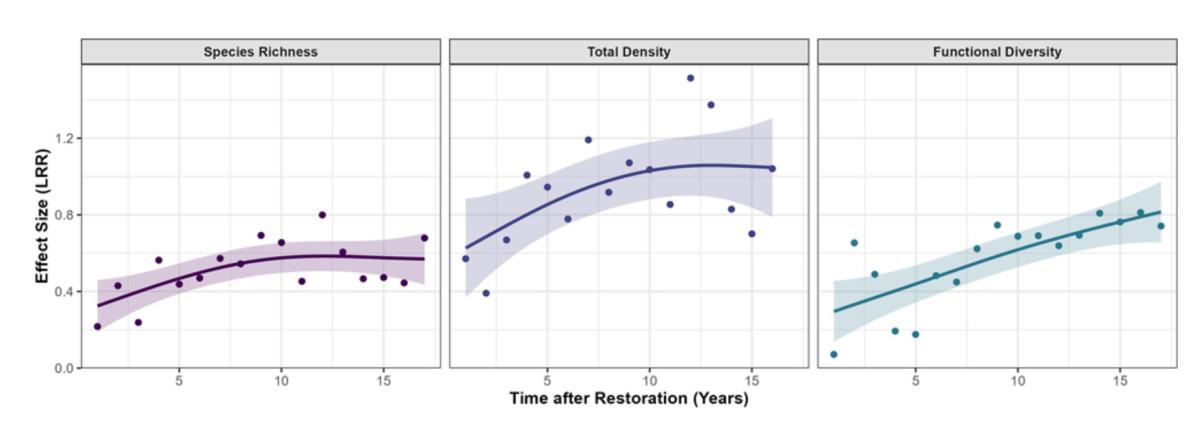
Figure 5. Temporal evolution of the restoration effect size (log-response ratio) for the stenothermic fish guild at 37 revegetated sites, based on species richness (left), total density (middle), and functional diversity (right).
10. Knowledge gaps
Due to their complexity, BACI-type monitoring designs require a considerable monitoring effort to obtain results. Existing and new labour- and data-intensive techniques may provide alternatives to standard monitoring methods, ensuring cost-effective and accurate measurements (Van der Lee et al., 2024, https://doi.org/10.1016/j.scitotenv.2024.171413). In terms of species assessments and other biological parameters, alternative methods, such as DNA metabarcoding and eDNA, could be applied. While these approaches are promising, the extent to which they can be applied within a restoration effect assessment framework remains to be seen.